May 30, 2019
The website Awesome public datasets contains links to several hundred datasets. This example deals with a randomly selected one, Hyperspectral benchmark dataset on soil moisture
That dataset is described as being a sequence of measurements of a soil sample, recording temperature, soil moisture, and the intensity at each of 125 light frequency bands (in nm) of an image of the sample.
Process
- Download the ZIP file.
- Uncompress the ZIP file
This results in a directory with a CSV file, a README.txt, and a license file.
- Use the “Import Dataset” tool in the Environment tab to read in the data. The tool constructs a command, which is used in the following chunk.
library(readr)
Soil <-
   read_csv("~/Downloads/felixriese-hyperspectral-soilmoisture-dataset-657d5d0/soilmoisture_dataset.csv",
   col_types = cols(datetime = col_datetime(format = "%Y-%m-%d  %H:%M:%S")))
Notice the datetime format string used in the command. If working with time data, it’s helpful to know about how datetimes can be converted to machine readable format.
Looking at the Soil data frame …
nrow(Soil)## [1] 679head(names(Soil))## [1] "index" "datetime" "soil_moisture"
## [4] "soil_temperature" "454" "458"range(Soil$datetime)## [1] "2017-05-16 11:26:07 UTC" "2017-05-26 14:08:10 UTC"So we have slightly more than 10 days of measurements.
What to use the data for
The data were not gathered specifically for the purpose of teaching statistics, so there is no documentation that we can draw on to decide how to fit this dataset into a course. Creativity is required. Some ideas:
- Telling a story with simple graphics. Look at the time series of soil temperature and of soil_moisture.
- How much of moisture is accounted for by temperature.
library(ggformula)
library(dplyr)
gf_point(soil_temperature ~ datetime,  data = Soil)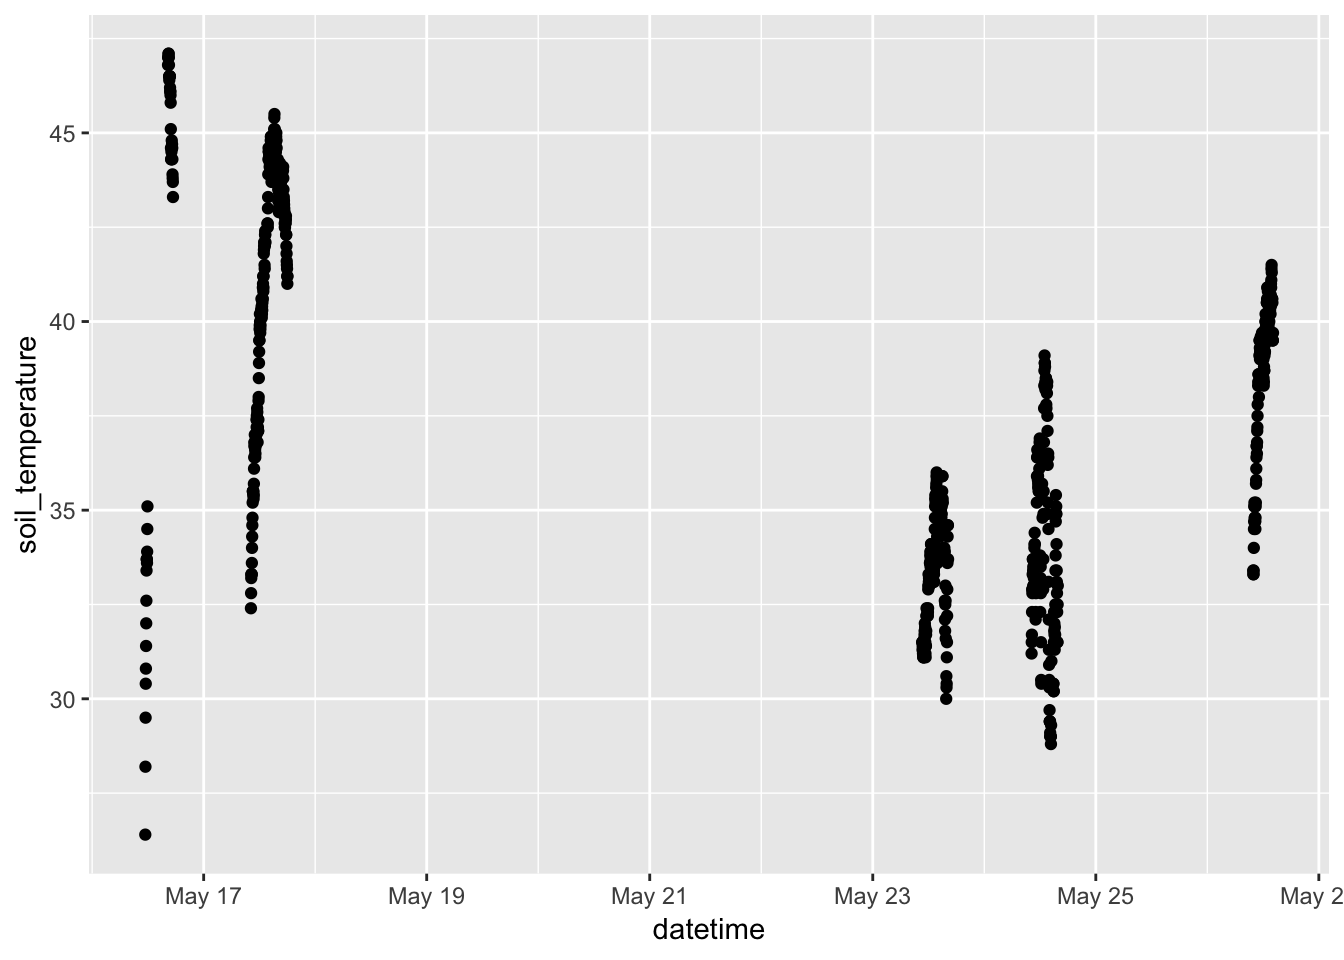
gf_point(soil_moisture ~ datetime, data = Soil)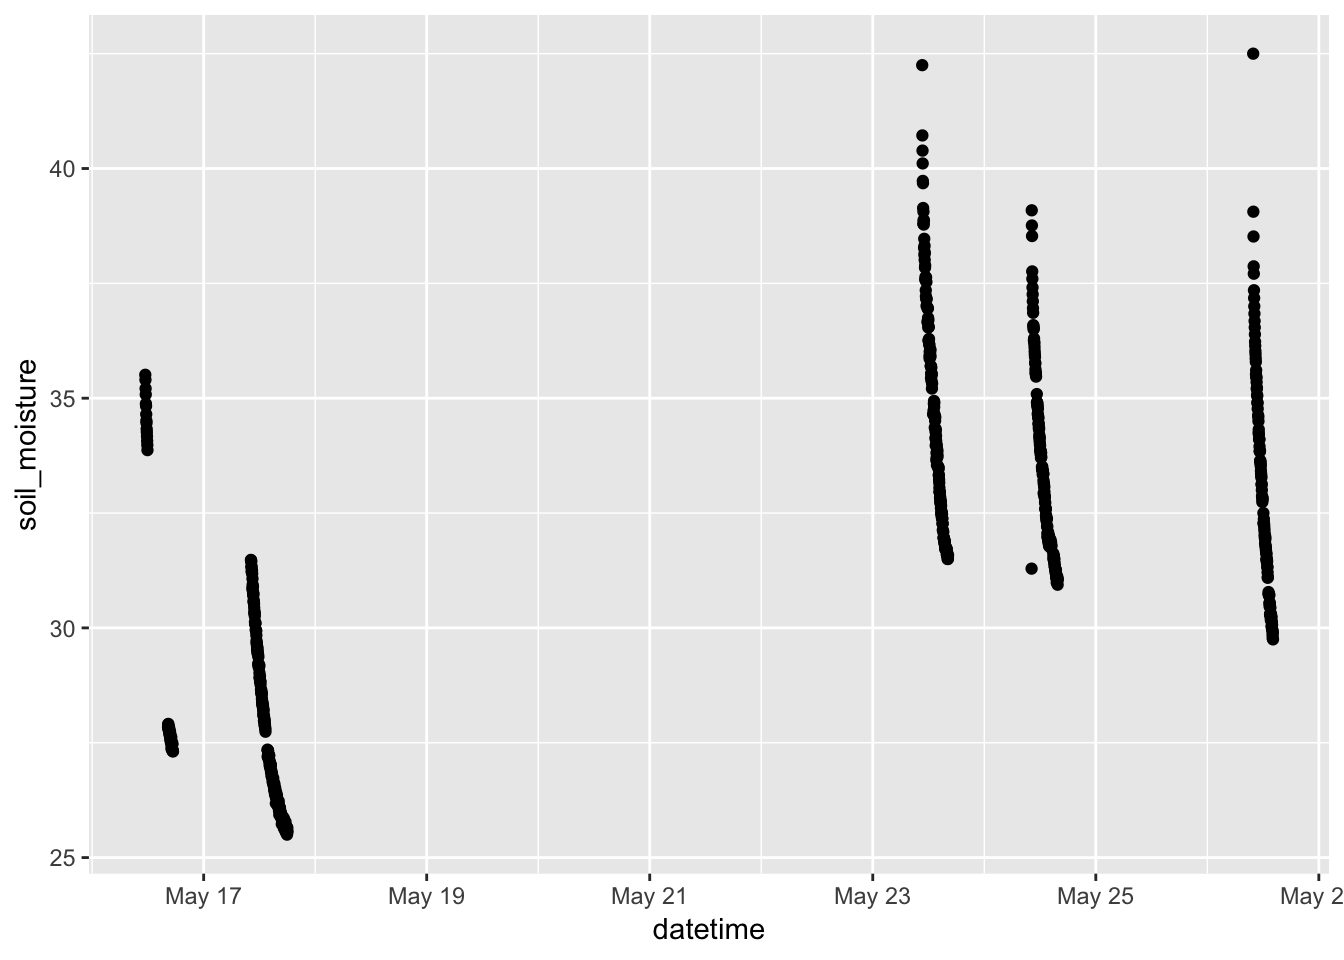
- What time of day were the measurements taken?
Soil %>%
  mutate(time = lubridate::hour(datetime) + lubridate::minute(datetime) / 60) %>%
  gf_jitter(time ~  1, data = Soil, width = 0.2) %>%
  gf_violin(fill  = "blue", alpha = 0.4,  color = NA) %>%
  gf_lims(x  = c(0, 2))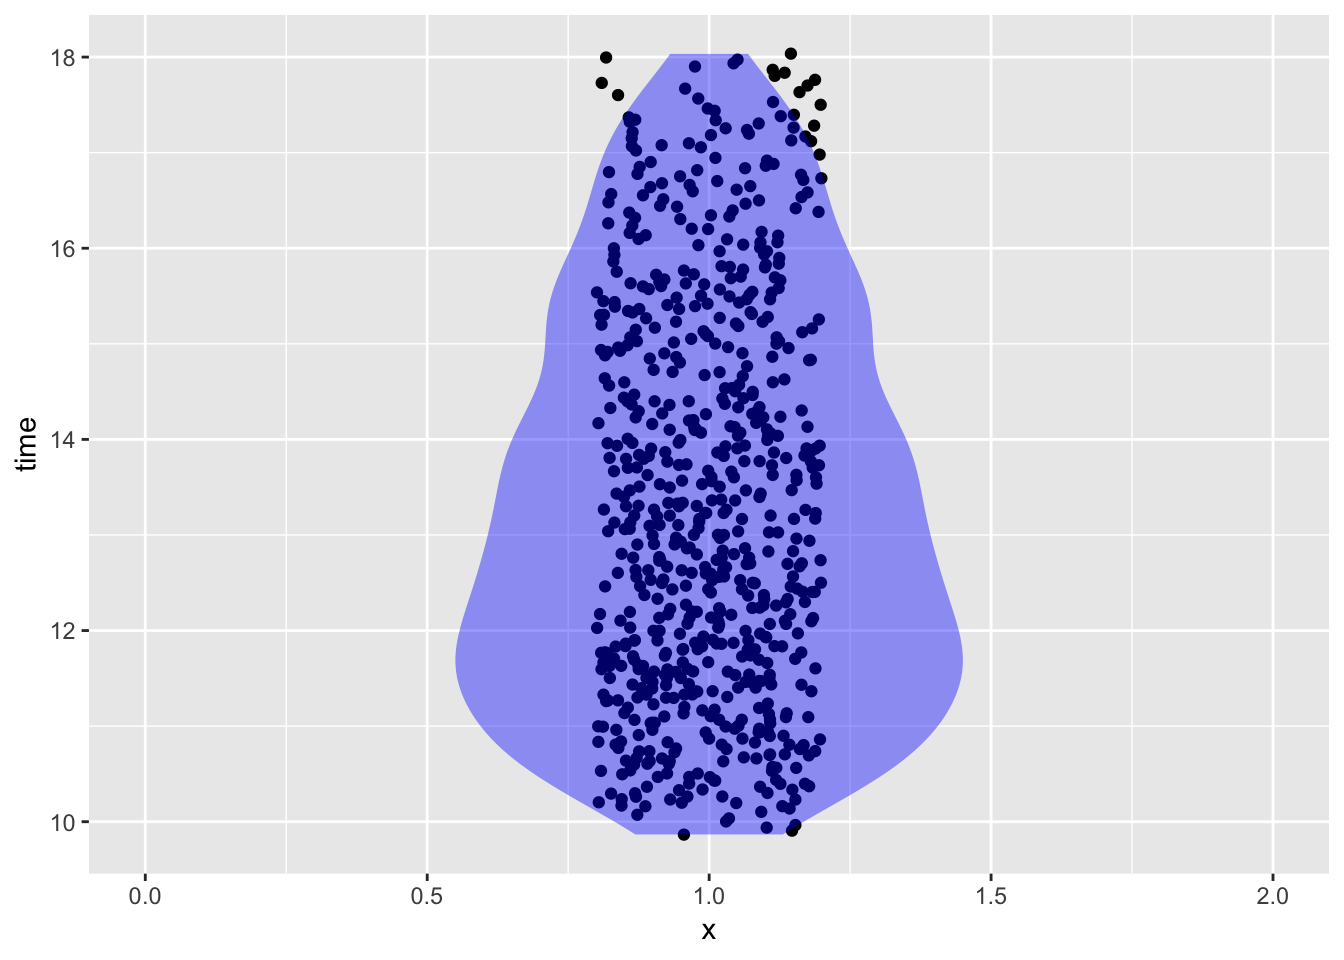
- Soil moisture as a function of time of day
Soil %>%
  mutate(time = lubridate::hour(datetime) + lubridate::minute(datetime) / 60,
         day = as.character(lubridate::mday(datetime))) %>%
  gf_point(soil_moisture ~  time, color = ~  day, data = Soil)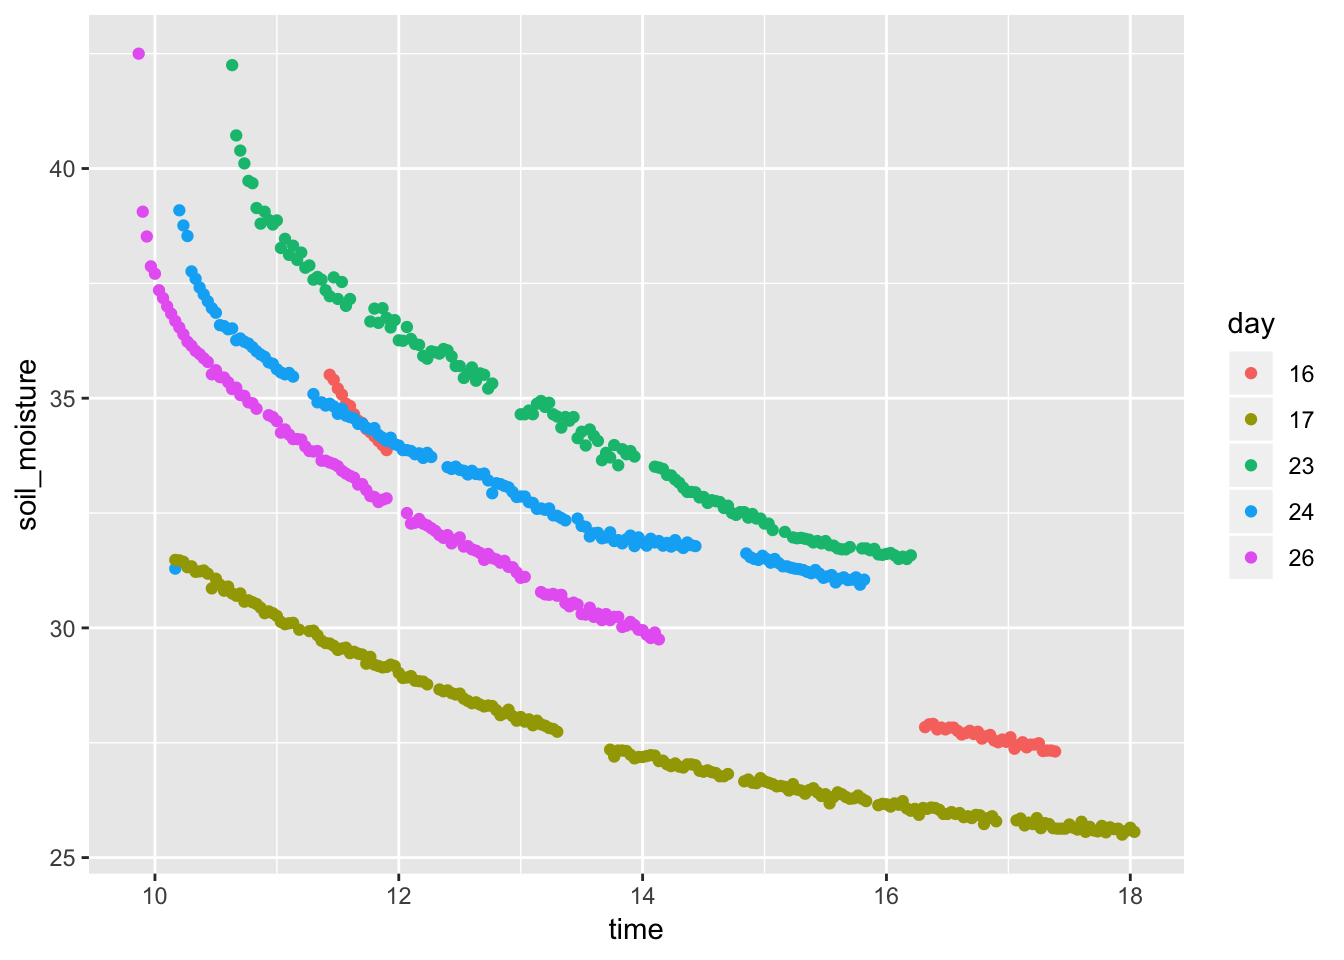
- Simple analysis. Is soil moisture a function of temperature?
- Is there a correlation?
gf_point(soil_moisture ~ soil_temperature, data = Soil)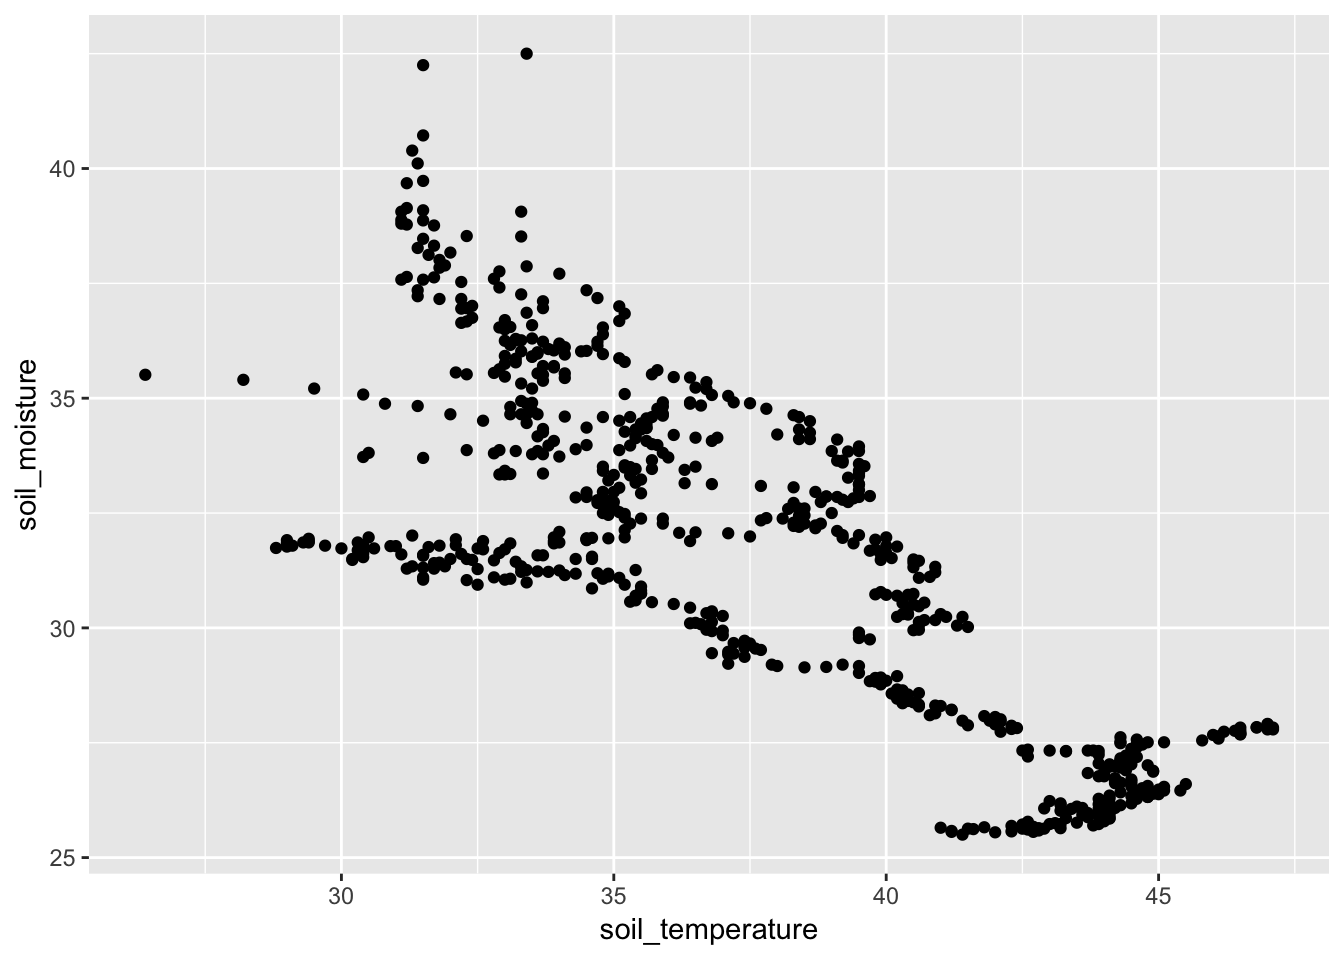
- Illuminating the pattern.
Soil %>%
  mutate(time = lubridate::hour(datetime) + lubridate::minute(datetime) / 60,
         day = as.character(lubridate::mday(datetime))) %>%
  gf_path(soil_moisture ~ soil_temperature, color = ~ day)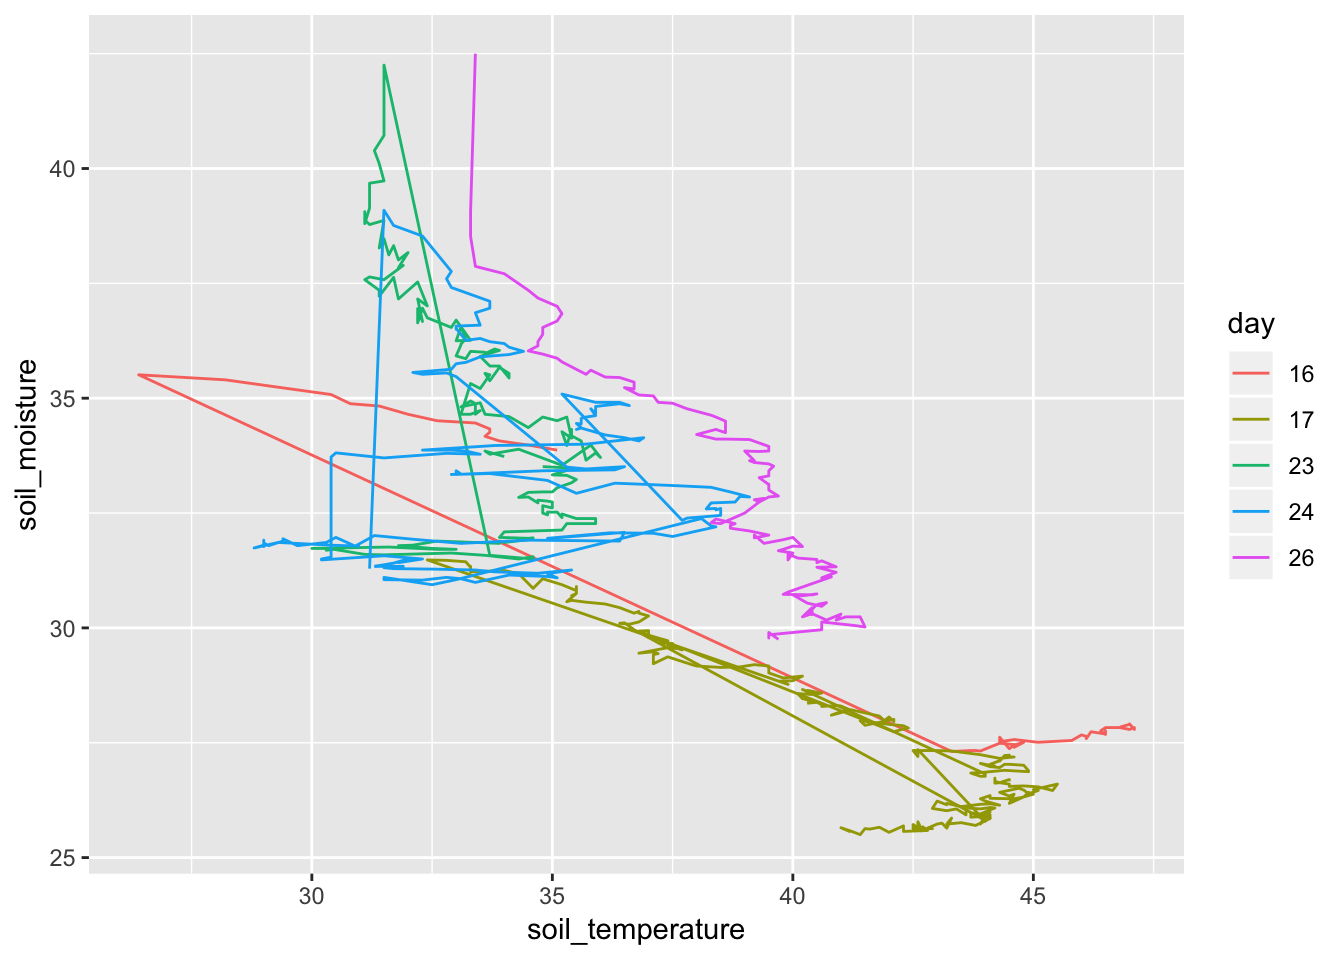
More advanced?
Perhaps we can use the spectral measures to read soil moisture?
library(rpart)
library(rpart.plot)
library(randomForest)
# need to rename variable
newnames <- function(df) {
  orig <- names(df)
  new <- ifelse(is.na(parse_number(orig)),  orig, paste0("v",  orig))
  return(new)
}
names(Soil) <- newnames(Soil)
## Warning: 4 parsing failures.
## row col expected actual
## 1 -- a number index
## 2 -- a number datetime
## 3 -- a number soil_moisture
## 4 -- a number soil_temperaturemod1 <-
Soil %>%
select(-index, -datetime) %>%
randomForest(soil_moisture ~ . - soil_temperature, data = .)
Tmp <- importance(mod1)
Res <- tibble(score = Tmp[, 1], wavelength = row.names(Tmp)) %>%
arrange(desc(score))
head(Res)## # A tibble: 6 x 2
## score wavelength
## <dbl> <chr>
## 1 902. v950
## 2 829. v946
## 3 519. v942
## 4 501. v830
## 5 391. v454
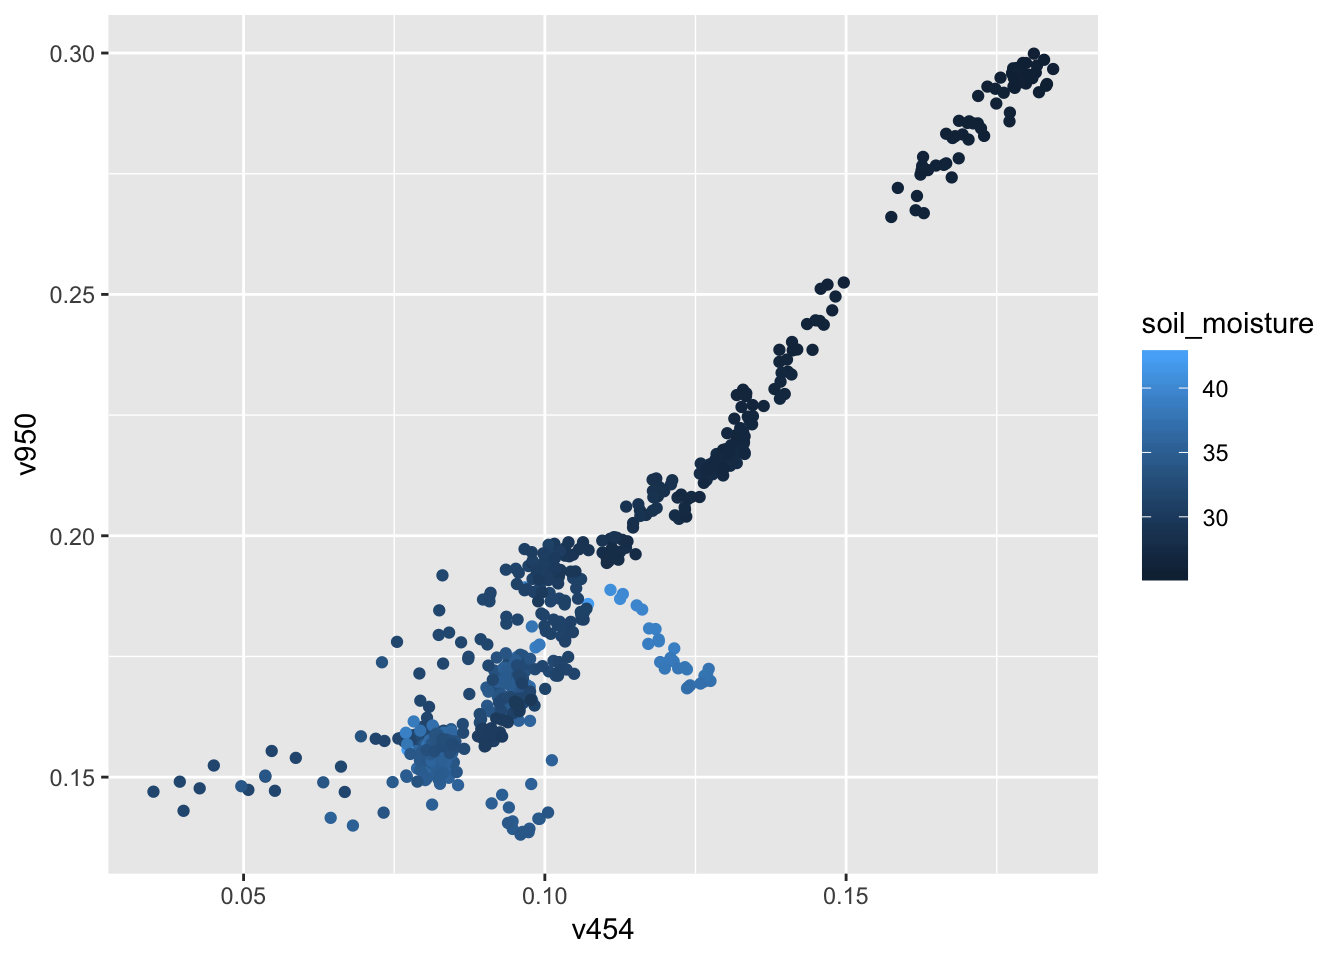
## 6 350. v906gf_point(soil_moisture ~ v950, data = Soil)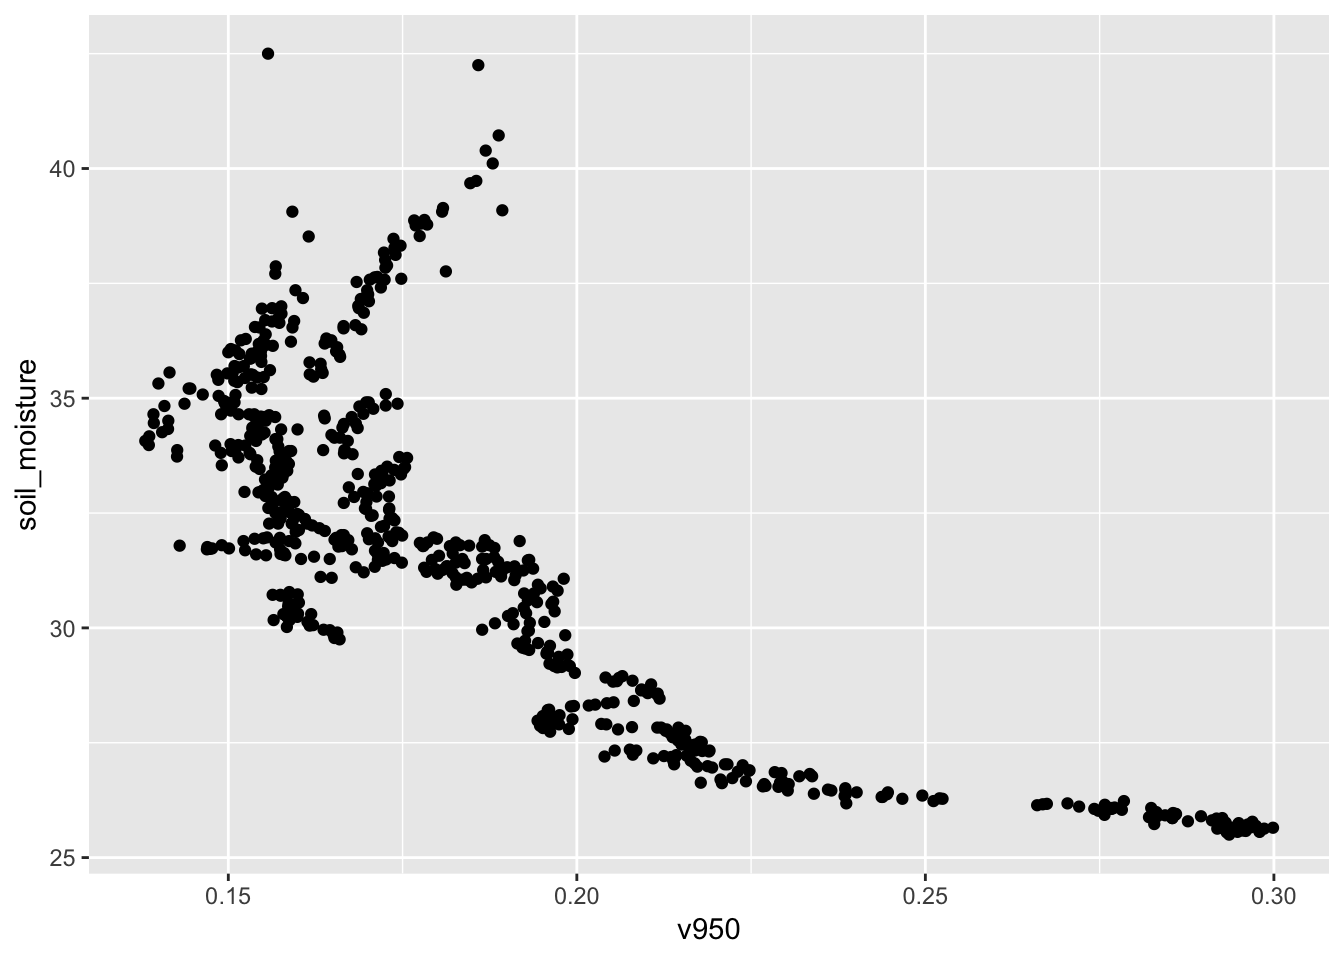
gf_point(v950 ~ v454, color = ~ soil_moisture, data = Soil)