
Providing links to your students
This document tells you how to grab a Word-formatted version of each activity or a web link to a plain HTML document containing the activity.
This document tells you how to grab a Word-formatted version of each activity or a web link to a plain HTML document containing the activity.
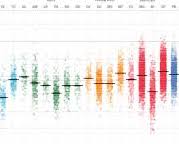
Jittering is a graphical technique that extends point plots to make them more informative about categorical variables.

Introduces the distinction between quantitative and categorical variables, the *range* of a quantitative variable and the *levels* of a categorical variable.

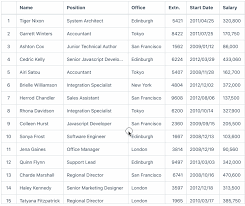
Gets students to think about what is the unit of observation in each data set and how to look up the meaning of each variable.
Reasons to identify one variable as the response and another as the explanatory.
We typically describe variation or uncertainty using an *interval*. The 95% summary interval is a way to describe the spread of a variable.
Causality as a reason to identify one variable as the response and another as the explanatory.
Relating the 95% summary interval to a traditional measure of spread: the standard deviation
Causality as a reason to identify one variable as the response and another as the explanatory.

Using the z-score to express everyday concepts of common and rare.
Discussion topics to introduce linear regression to your class.
Introduces terms such as skew, bi-modal, and flat, by reference to the difference of the actual variable from a theoretical normal distribution.
Normal distributions are a *family*. The specific members of the family are identified by two parameters: the mean and the standard deviation.
Describes the desired behavior of a confidence interval, that is, how to test whether a procedure produces a valid confidence interval.
A confidence interval will cover the population parameter with the right frequency only if the sample is unbiased. This lesson explores sampling bias.
Visualizing sampling variation in the difference between two groups.
Using plain confidence intervals on the mean to decide if there's good evidence that the means are different.
Having already looked at the overlap of confidence intervals on the means of two groups, formalizing the process as a t-test.
Translating a regression line into a description in everyday terms.
Using R-squared to quantify how much of the variation in a response variable is accounted for by explanatory variables.
Introduces the distinction between quantitative and categorical variables through their very different appearances in a point plot.

NOT YET AVAILABLE. Finding a confidence interval by repeatedly sampling from the sample.
NOT YET AVAILABLE. Determine whether a curved or straight-line relationship is a better description of the relationship between two quantitative variables.
Support provided by the National Science Foundation (grant DUE-1626337).
Template by Bootstrapious. Ported to Hugo by DevCows DATA photos by janneke staaks