By Danny Kaplan | April 16, 2019
Births_2014. Click here to launch.
The bootstrapping little app is a little different than most of the others: it’s graphic illustrates a concept rather than providing a means to explore data.
The concept, of course, is the confidence interval. Rather than using a formula to compute the standard error, in bootstrapping you draw a new sample from the sample itself in order to indicate the amount of sampling variability.
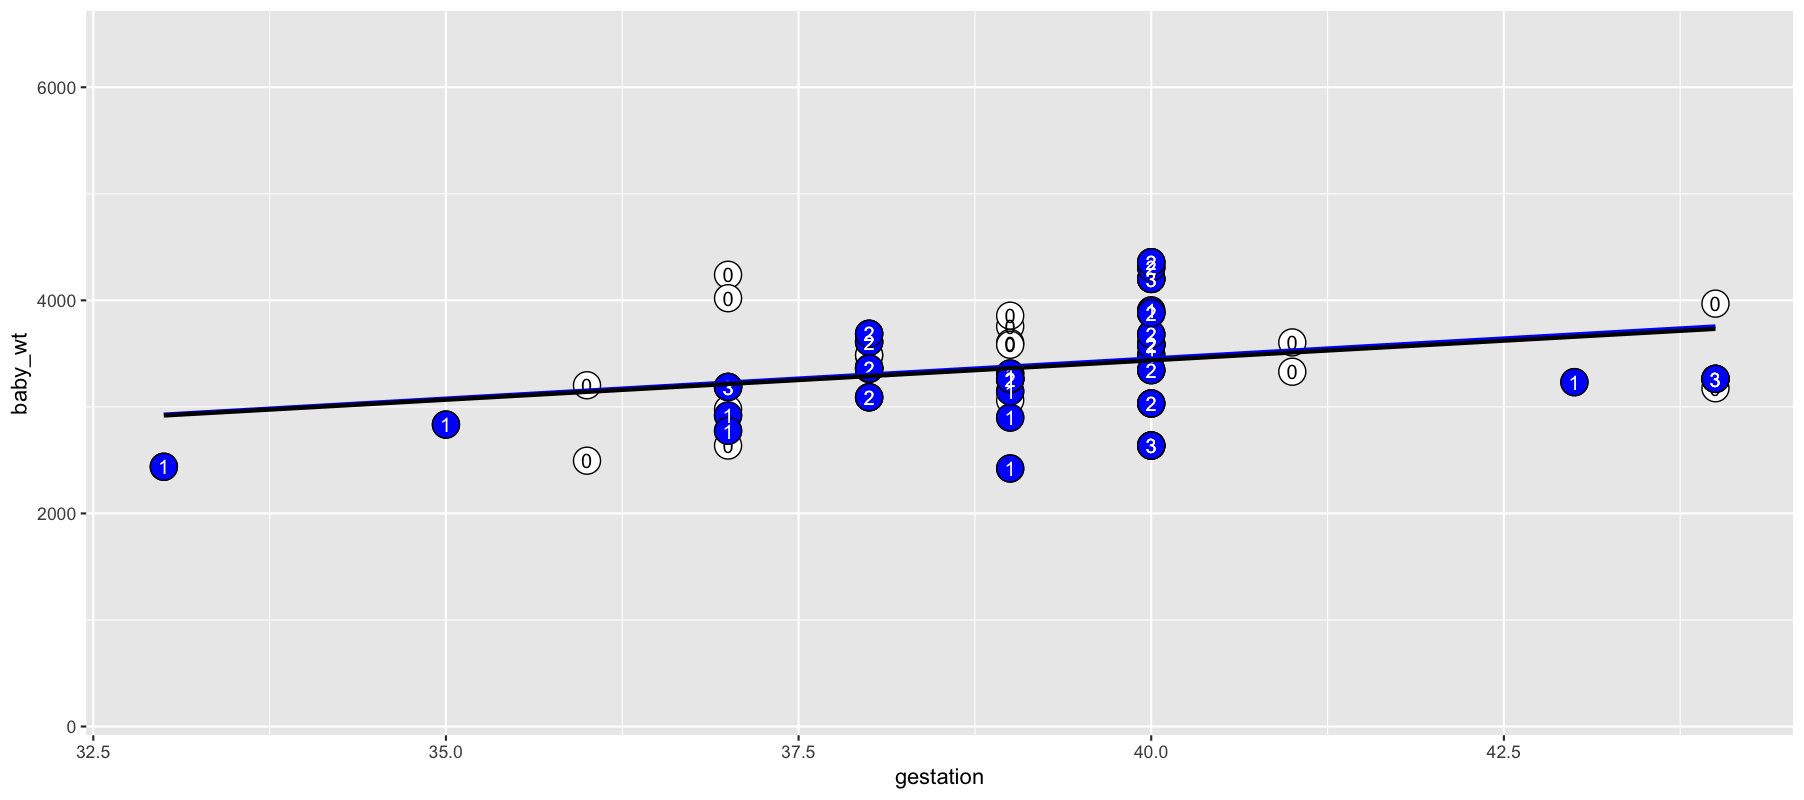
There are two main displays. One shows individual bootstrapping trials. The original sample itself is indicated by the circle-shaped points. The bootstrap sample is made up of a subset of these points, colored blue, although some points in that subset are duplicated (as shown by the number in each blue circle). In each trial, the selected sample statistic is shown along with the same statistic calculated on the bootstrap sample. They are typically different.
The other display shows the results of multiple bootstrapping trials. The distribution is easy to see. This distribution corresponds to the confidence interval.
Those new to bootstrapping are sometimes surprized to see that you can calculate a standard error without formulas or probability theory. Actually, the logic of estimating the sampling distribution is based on the idea of bootstrapping. Ronald Fisher described this in 1936:
It may be asked how we can speak of “how often” a certain average will be recorded in a thousand trials when, in fact, we have only one sample to base our knowledge on. … The simplest way of understanding quite rigorously, yet without mathematics, what the calculations of the test of significance amount to, is to consider what would happen if our two hundred actual measurements were written on cards, shuffled without regard to nationality, and divided at random into two new groups of a hundred each. This division could be done in an enormous number of ways … We may suppose that for each of these ways the difference between the two average statures is calculated. … [If] the two populations were homogeneous, there would be nothing to distinguish the particular subdivision in which the Frenchmen are separated from the Englishmen from among the aggregate of the other possible separations which might have been made [by shuffling the cards].
So why don’t we carry out the calculation this way?
Actually, the statistician does not carry out this very simple and very tedious process, but his conclusions have no justification beyond the fact that they agree with those which could have been arrived at by this elementary method.
It’s a matter of avoiding tedium, not that algebra gives a better answer. In the almost 100 years since Fisher wrote, we’ve developed other ways for avoiding tedium, specifically the use of computers.