By Danny Kaplan | May 31, 2017
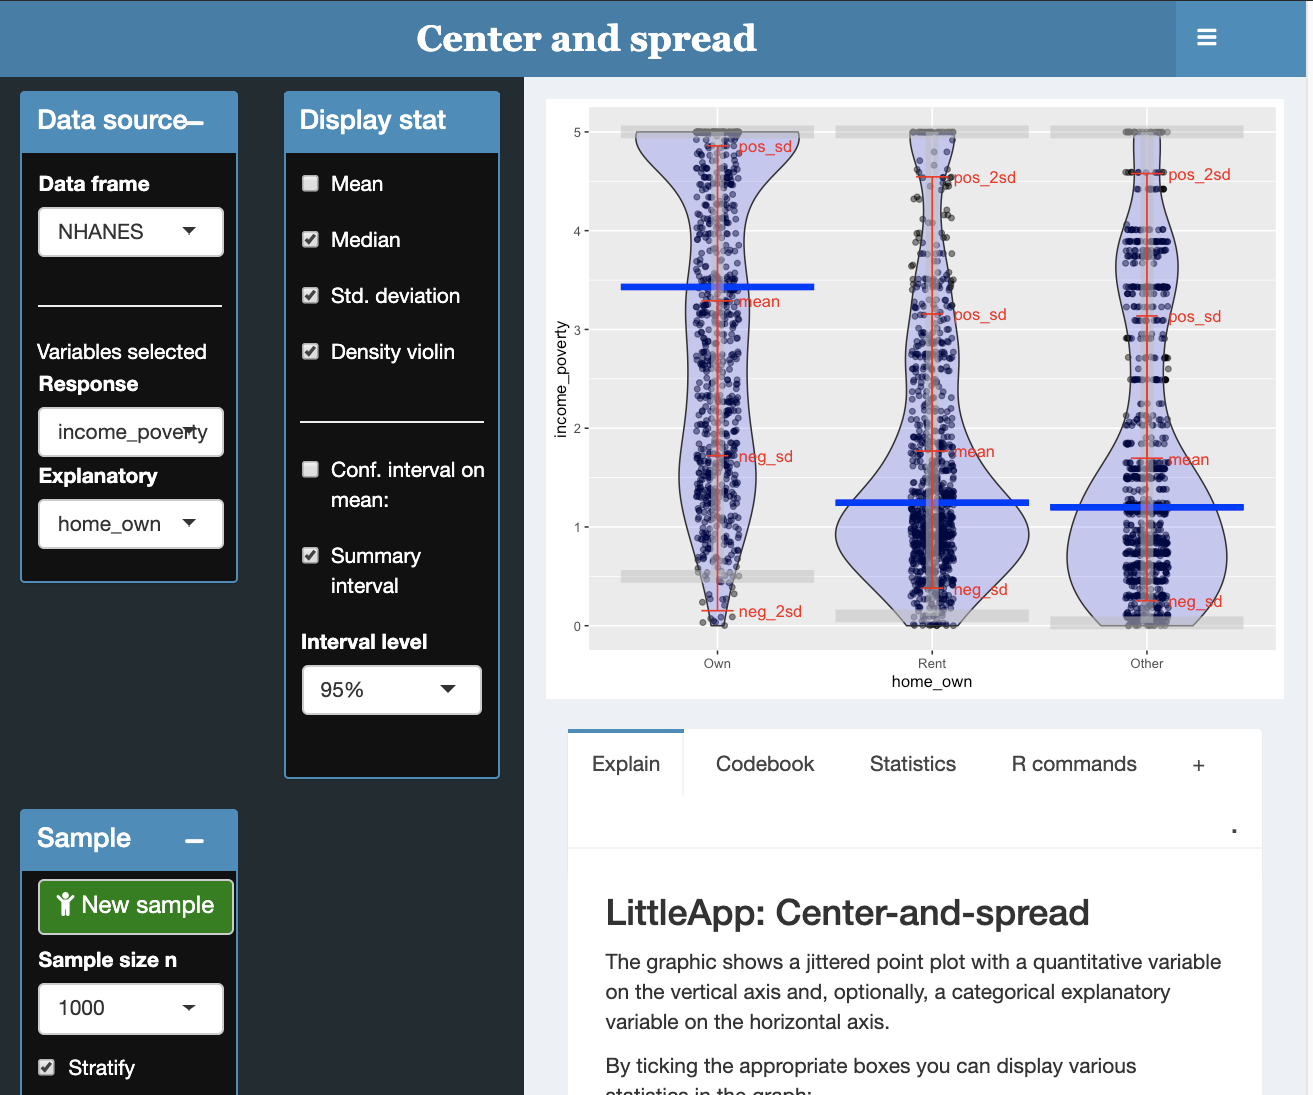
The Center-and-spread Little App displays a jittered point plot of the response variable, which can be annotated with a variety of statistics often used to quantify “center” and “spread.”
- Standard deviation “ruler” helps clarify that the sd is a distance rather than a value of the variable.
- Compare the confidence interval on the mean to the summary interval of the response variable. This helps to dispell the misconception that the confidence interval contains most of the data.
- Measuring stick to support reading values and differences off the graph.
- Explore robustness by selecting new samples from the population.
Suggested StatPREP 101 activities
comments powered by Disqus