May 10, 2019
We almost always work with variables that are either …
- quantitative
- categorical with only two levels
In relating two variables, there are four possible situations
| Quantitative | Categorical | |
|---|---|---|
 |
|
|
| Quant. | slope of regression line or correlation coefficient | difference in two means |
| …………. | …………………………………… | ………………………………………. |
| Categ. | ?????? | difference in two proportions |
Presentation in terms of algebra
| Quantitative | Categorical | |
|---|---|---|
|
|
|
| Quant. | ||
| …………. | …………………………………… | ………………………………………. |
| Categ. | ?????? |
… and associated distributions: t and z
Data beats formulas
| Quantitative | Categorical | |
|---|---|---|
|
|
|
| Quant. | 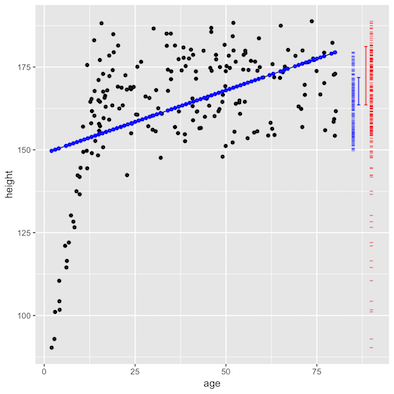 |
 |
| …………. | …………………………………… | ………………………………………. |
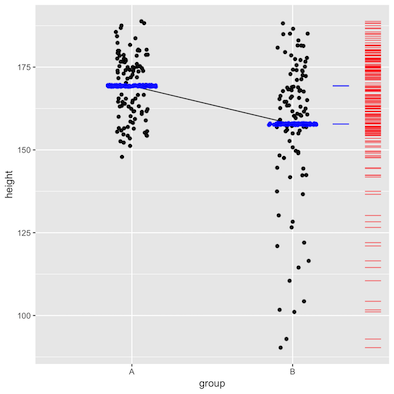
| Categ. |  |
 |
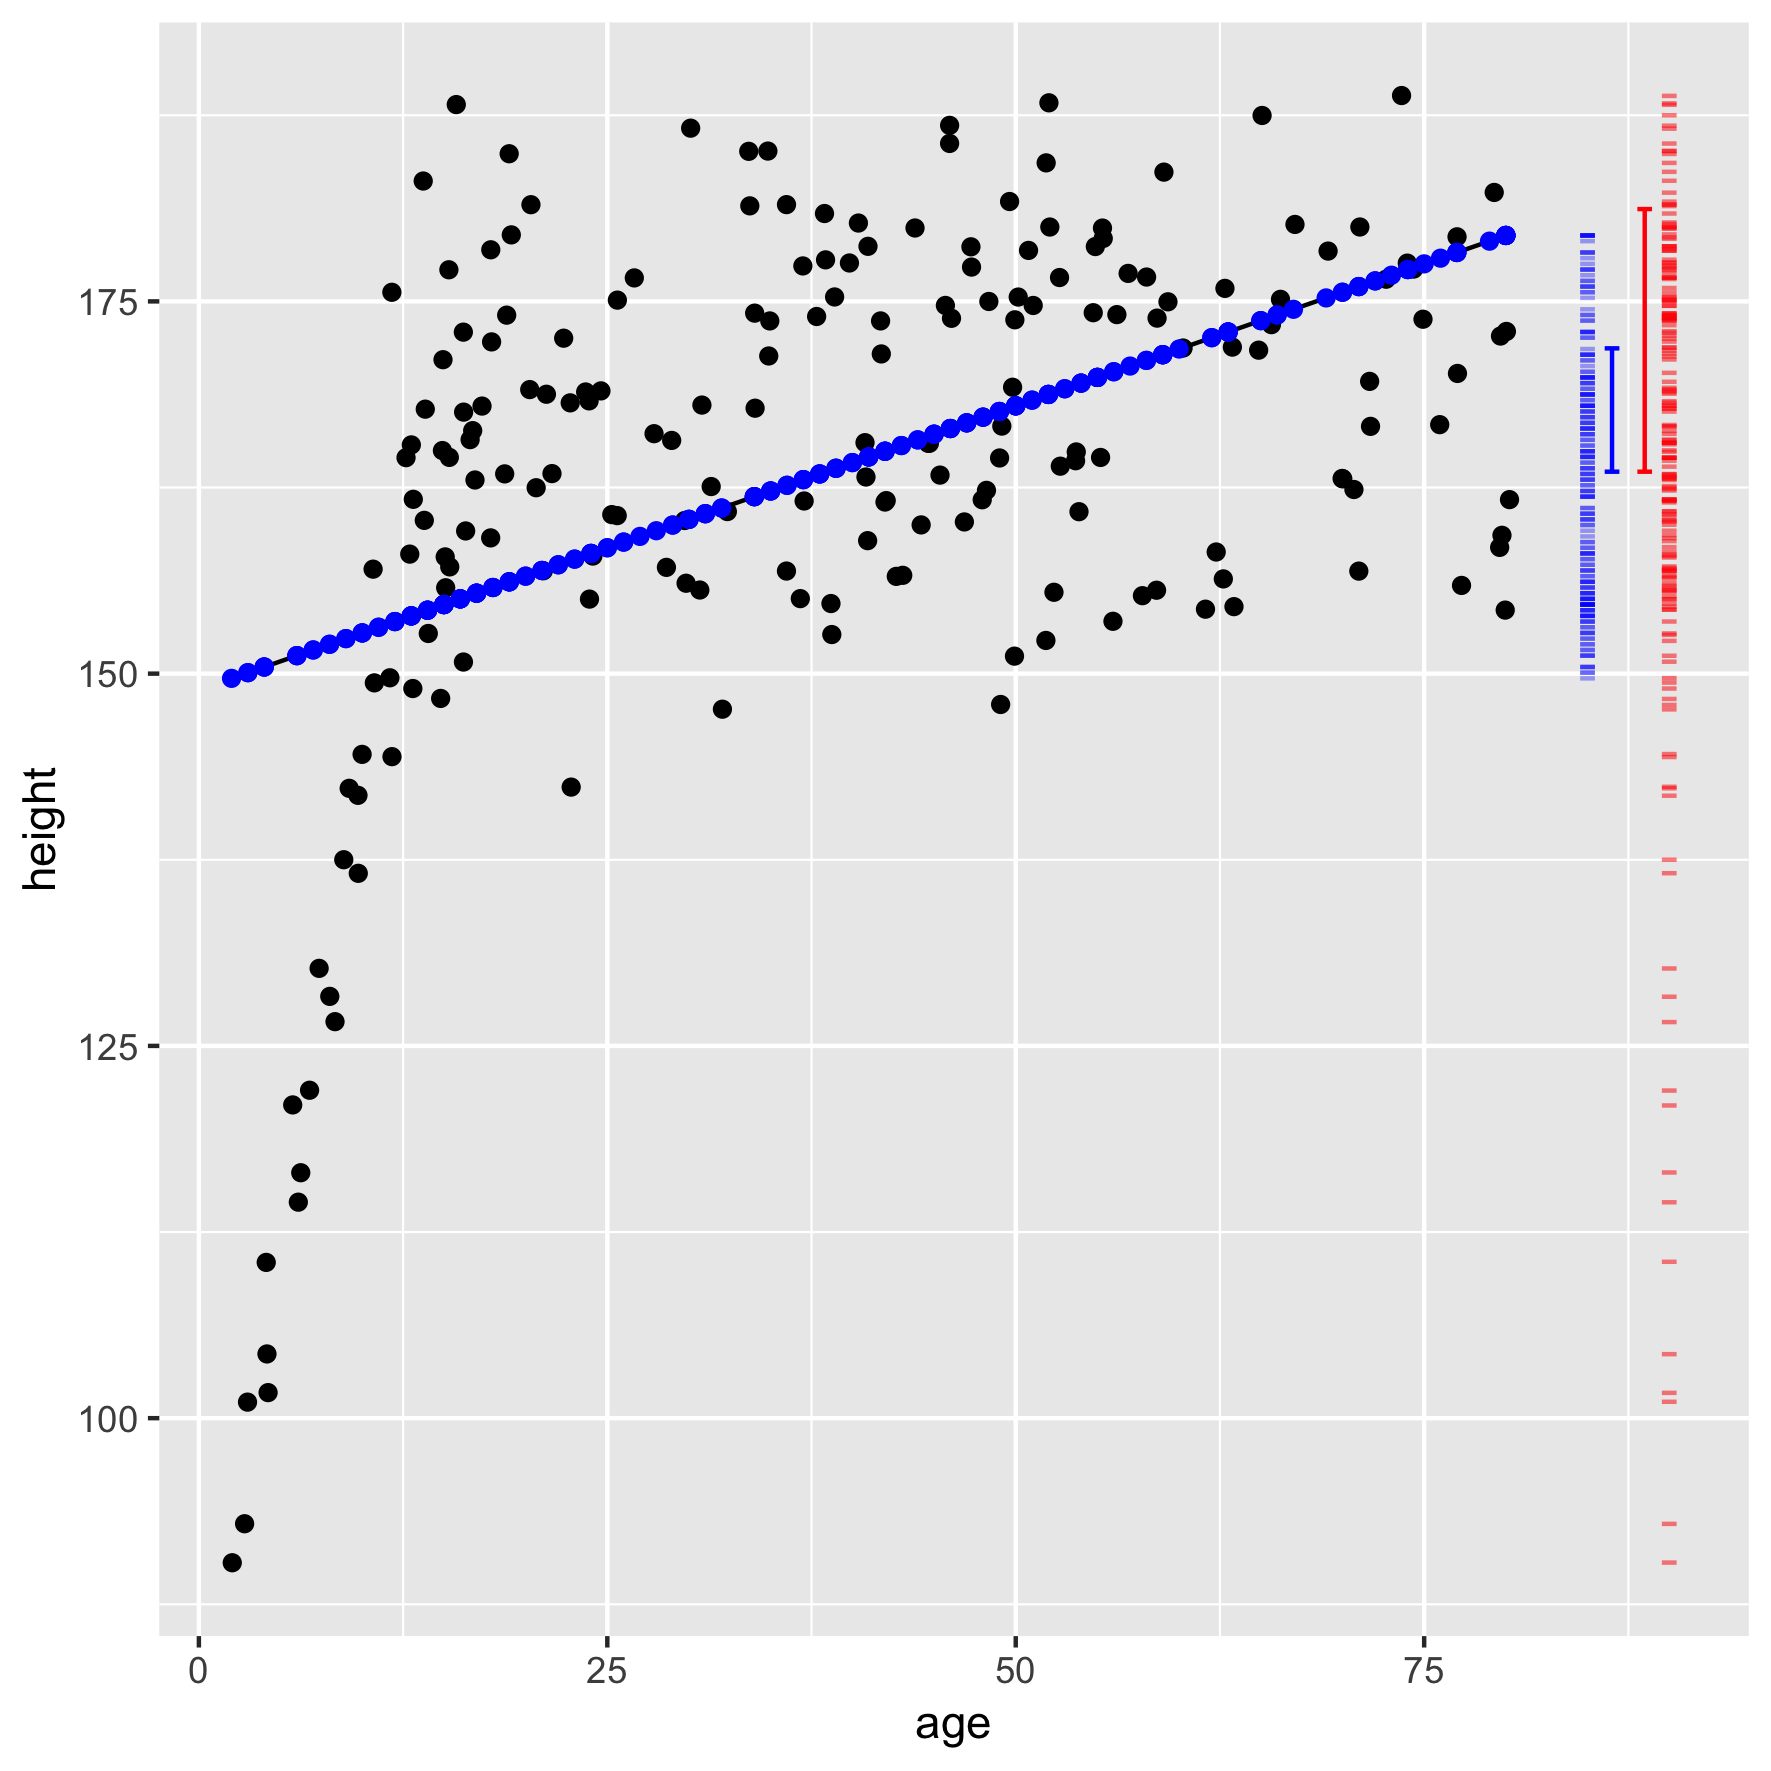
Raw and model values
The error bars show the size of the standard deviation.
The formal inference procedure
- Measure the effect size. Call it :
- slope for Quant vs Quant or Cat vs Quant
- difference for Quant vs Cat or Cat vs Cat
- Take the ratio of the model-value standard deviation to the raw-value standard deviation. Call this ratio .
- Compute the ratio of “explained” to “unexplained”:
Eyeballing from the four models (which had n = 200)…
| Quantitative | Categorical | |
|---|---|---|
| Quantitative | ||
| per year | ||
| Categorical | ||
Confidence interval on is always
p-value … Look up in this graph.
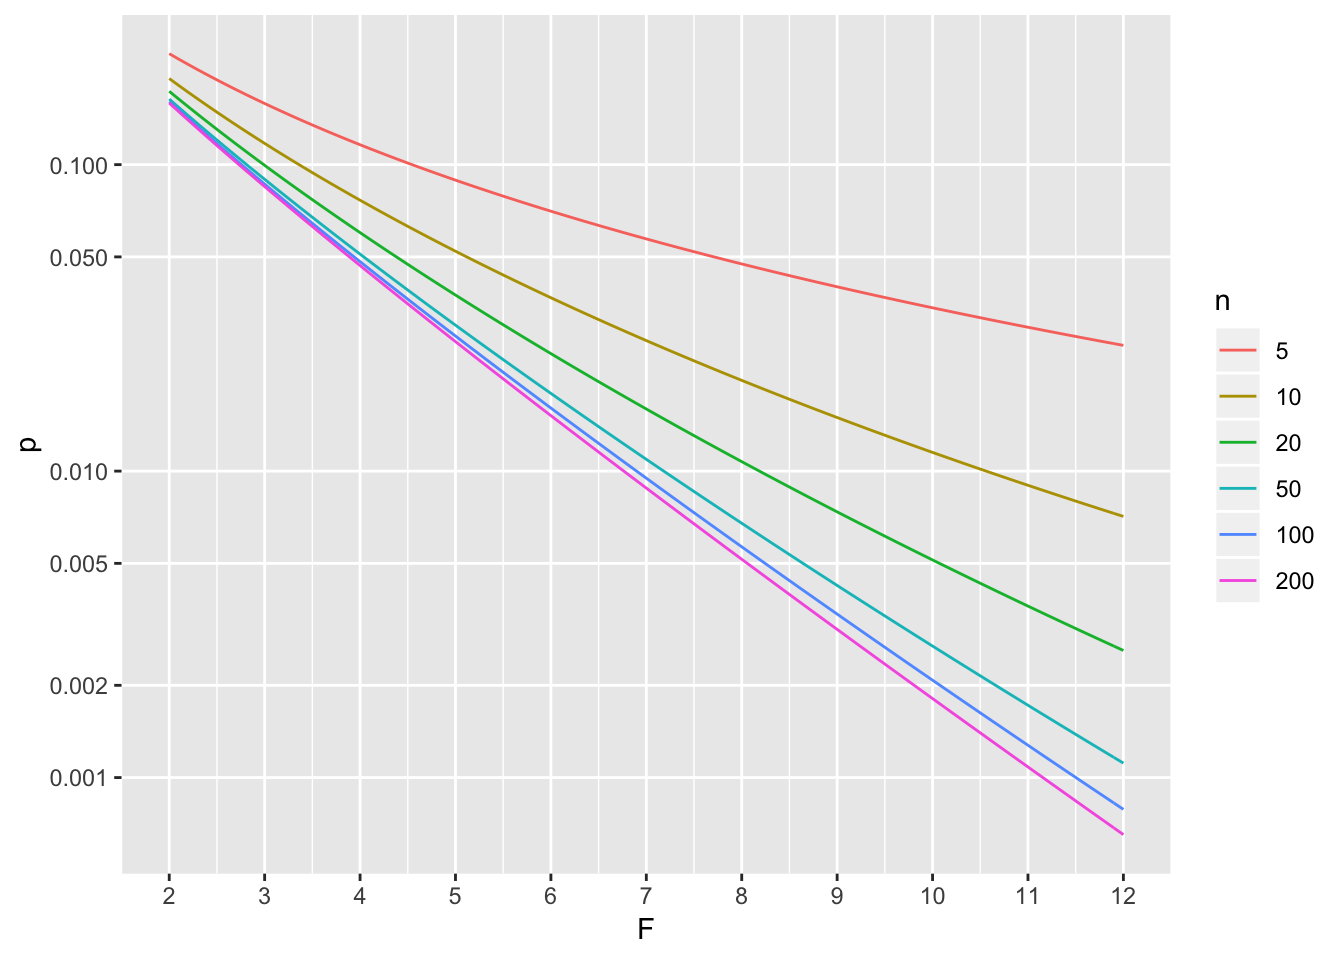
Freebies:
- correlation coefficient , where the branch is based on the slope.
- Prefer t? It’s . But F is more general than t.